Dashboards
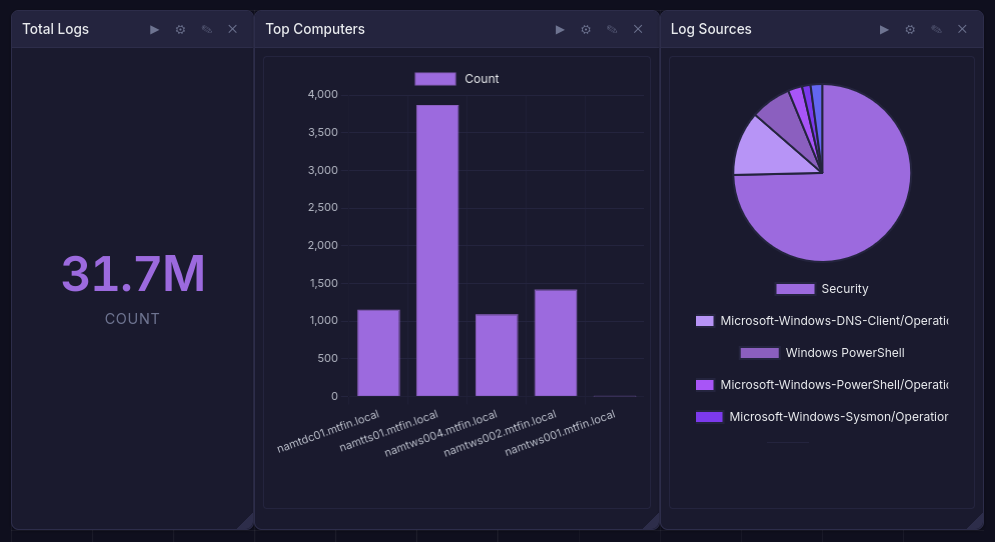
Dashboards provide a grid of widgets, each running an independent Quandrix query. Use them to build monitoring views scoped to a fractal or prism.
Creating a Dashboard
Navigate to Dashboards within a fractal or prism. Click Create and provide a name and optional description.
Widgets
Each widget is a self-contained panel with:
- Title - descriptive label
- Query - a Quandrix query
- Chart type -
table,piechart,barchart, orgraph - Layout - position and size on the 12-column grid (drag to rearrange and resize)
Widget results are cached so the dashboard loads quickly on return visits.
Time Range
A dashboard-level time range applies to all widgets. Options include preset ranges (1h, 24h, 7d, 30d) or a custom start/end.
Variables
Dashboard variables let you parameterize queries across widgets. Define name-value pairs, then reference them in widget queries. Changing a variable value re-runs all affected widgets.
Export & Import
Dashboards can be exported as YAML and re-imported into the same or a different fractal. This is useful for sharing standard monitoring layouts across teams.
Access Control
- Viewer - can view dashboards
- Analyst - can create, edit, and delete dashboards and widgets
Notebooks
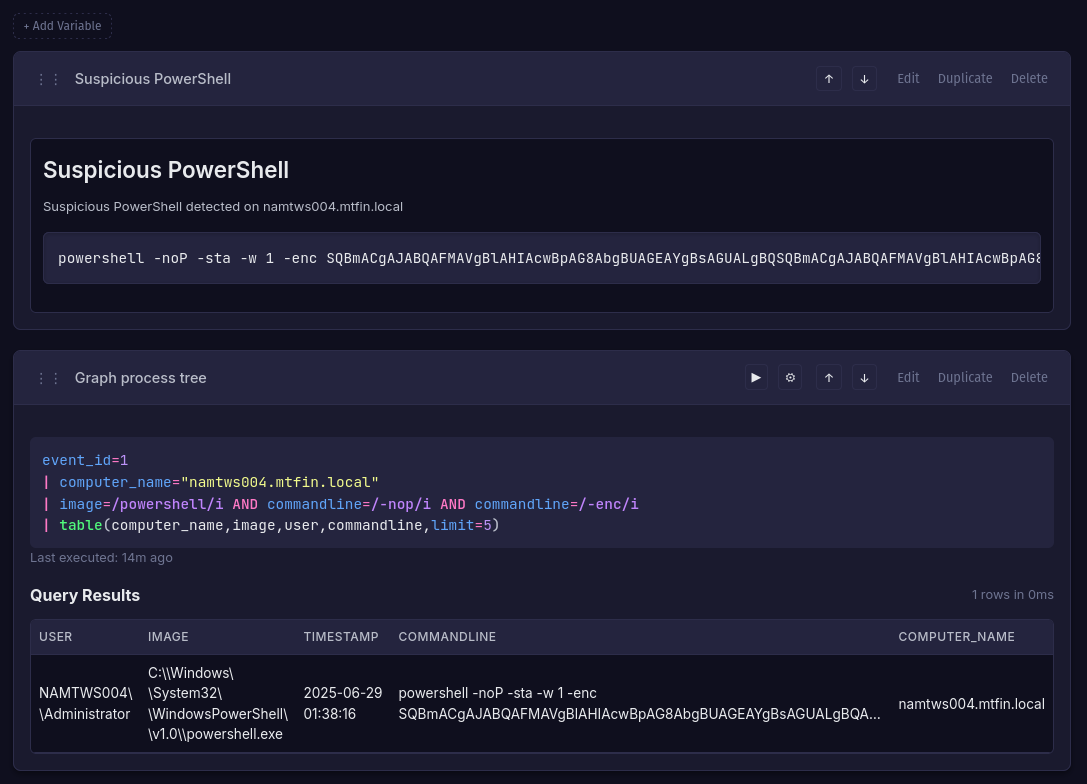
Notebooks combine markdown documentation and executable Quandrix queries in a single ordered document. They are useful for incident investigations, runbooks, and collaborative analysis.
Creating a Notebook
Navigate to Notebooks within a fractal or prism. Click Create and provide a name and optional description.
Sections
Notebooks contain two types of sections:
- Markdown - formatted text for documentation, notes, and context
- Query - a Quandrix query that can be executed and re-run. Results are cached with the section and can be displayed as a chart
Sections can be reordered by dragging.
Time Range
A notebook-level time range applies to all query sections. This ensures consistent results across an investigation.
Variables
Like dashboards, notebooks support variables that can be referenced in query sections.
Export & Import
Notebooks export as YAML for sharing and version control.
Presence
Both dashboards and notebooks show which users are currently viewing, supporting real-time collaboration.